k-mer mask optimization
Optimizing a k-mer mask is a balance between k-mer size and the degree to which enzymatic sequence bias is corrected. Choosing masks with more than 8 masked positions can result in an insufficient number of k-mers to accurately correct biases, because few sequences may exisit in some k-mer sequence bins. When more positions are included there is often has very little affect on the correction factor, so more information results in diminishing returns. Herein we describe two orthogonal methods to optimize k-mer masks using DNase and ATAC data as examples.
Hill-Climbing k-mer mask optimization of ATAC-seq data
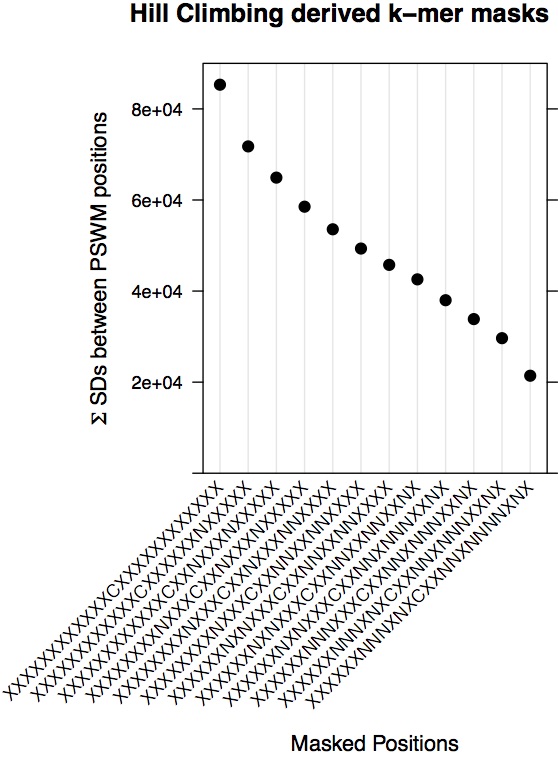
The method takes a starting kmer-mask, a set of site tables (one table per TF), and at each step turns an masked position into an unmasked position, choosing the position that results in the lowest score. It iterates until there are no more unmasked positions. This approach requires many kmer-mask evaluations, which correspond to full runs of seqOutBias. It can run multiple instances of seqOutBias in parallel (see mc.cores parameter) if one has a machine with sufficient resources. At each step all possible positions to change an X to an N are evaluated and the one that results in the smallest score is chosen. For each PSWM, the standard deviation is computed for the profile obtained by summing, at each position in the PSWM, the scaled read counts across all sites. This scoring metric, which is the sum of these standard deviations across the set of PSWMs, is used to define the next position in the mask. Herein, we exclusively use the plus strand aligned reads.
load.sites <- function(filenames) {
    lapply(filenames, function(filename) {
        fimo = read.table(filename)
        bed6 = fimo[, c(2,3,4,1,6,5)]
        bed6
    })
}

sites = load.sites(c("~/ATAC_Walavalkar/CTCF_fimo.txt",
    "~/DNase_ENCODE/Elf1_fimo.txt",
    "~/DNase_ENCODE/Gata3_fimo.txt",
    "~/DNase_ENCODE/Max_fimo.txt",
    "~/ATAC_Walavalkar/SP1_fimo.txt",
    "~/ATAC_Walavalkar/EBF1_fimo.txt",
    "~/ATAC_Walavalkar/REST_fimo.txt"))

names(sites) = c("CTCF", "Elf1", "Gata3", "Max", "SP1", "EBF1", "REST")

source("https://raw.githubusercontent.com/guertinlab/seqOutBias/master/docs/R/seqOutBias_hcsearch.R")

seqOutBias.args = "--read-size=76 ~/DNase_ENCODE/hg38.fa ~/ATAC_Walavalkar/C1_gDNA_PE1_plus.bam ~/ATAC_Walavalkar/C1_gDNA_PE2_plus.bam"
seqOutBias.cmd = "seqOutBias"

initial.mask = "XXXXXXXXXXXXCXXXXXXXXXXXX"

#this command can be interrupted when the user is satisfied with the mask:
result.table = hc.search(sites, initial.mask, seqOutBias.args, prefix = "runhc_", sqcmd = seqOutBias.cmd, mc.cores = 4)

system(paste('seqOutBias ', seqOutBias.args, ' --no-scale --out=runhc_XXXXXXXXXXXXCXXXXXXXXXXXX.tbl --bw=runhc_XXXXXXXXXXXXCXXXXXXXXXXXX.bw')

hc.atac.cutmasks = c('XXXXXXXXXXXXCXXXXXXXXXXXX',
    'XXXXXXXXXXXXCXXXXXXNXXXXX',
    'XXXXXXXXXXXXCXXNXXXNXXXXX',
    'XXXXXXXXNXXXCXXNXXXNXXXXX',
    'XXXXXXXXNXXXCXXNXXXNNXXXX',
    'XXXXXXXXNXXXCXXNNXXNNXXXX',
    'XXXXXXNXNXXXCXXNNXXNNXXXX',
    'XXXXXXNXNXXXCXXNNXXNNXXNX',
    'XXXXXXNXNXXXCXXNNXNNNXXNX',
    'XXXXXXNNNXXXCXXNNXNNNXXNX',
    'XXXXXXNNNXNXCXXNNXNNNXXNX',
    'XXXXXXNNNXNXCXXNNXNNNNXNX')

em.scores.atac = mclapply(hc.atac.cutmasks, function(cutmask) {
    bw.paths = run.cutmask(cutmask, seqOutBias.args, sqcmd=seqOutBias.cmd, clean = FALSE, prefix = "runhc_") bw.plus = load.bigWig(bw.paths[1])
    bw.minus = load.bigWig(bw.paths[2])
    eval.cutmask(sites, bw.plus, bw.minus)
}, mc.cores = 4)

save(em.scores.atac, file="em.scores.atac.hc.Rdata")

require(lattice)
hc.atac.cutmasks = factor(hc.atac.cutmasks, levels=hc.atac.cutmasks)
pdf("ATAC-kmer_optimization.pdf", useDingbats=FALSE, width=4, height=6)
dotplot(as.numeric(em.scores.atac) ~ hc.atac.cutmasks,
    pch = 19,
    cex =1,
    col = 'black',
    main = "Hill Climbing derived k-mer masks",
    xlab = 'Masked Positions',
    ylim = c(0, 90000),
    scales=list(x=list(rot=45)),
    ylab = expression(paste(Sigma, ' SDs between PSWM positions')))
#for each set of TF PSWMs we sum the intensity of signal at each position, #then we take the standard deviation between positions.
#The final metric is a sum of these standard deviations.
dev.off()
Expectation Maximization k-mer mask optimization of DNase-seq data
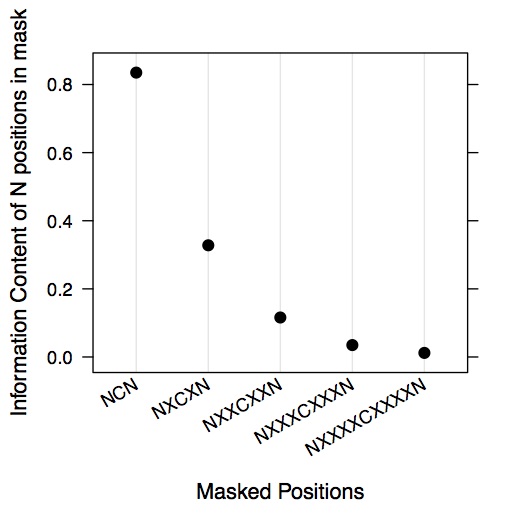
We developed a program that takes as input the k-mer count output of seqOutBias table and models the data as a set of binding sites, sharing a common motif, each with it’s unknown orientation. This is a constrained version of MEME (Bailey et al., 2006). This program will output a table of alternatives, where each row has more unmasked positions than the preceding rows. Unmasked positions are chosen by thresholding the information content of the resulting motif matrix. Running this with the –verbose flag, it will also output the PSWM. The resulting table has a column for the mask in the “forward” orientation and one where the mask in both directions is combined. The combined mask should be used if the data is not pre-split by strand. This approach is better suited for assays where a single enzyme with a preferred orientation cuts a particular site, producing reads in both directions, and one is interested in determining in more detail about what positions are influencing the choice of site.
The main disadvantages of this approach are: 1) it assumes that the mask is symmetric; 2) it requires a full counts table (all positions unmasked) as input; and 3) it requires multiple runs (automatically done in parallel) of the same computation, with random starting sites, to ensure a reasonably good global optimum for the motif PSWM.
setwd('~/DNase_ENCODE')
system('seqOutBias table hg38_36.10.5.5.tbl UW_MCF7_both.bam > UW_MCF7_both_10.5.5.txt')
system('cutmask_em --verbose UW_MCF7_both_10.5.5.txt > UW_MCF7_both_10.5.5.verbose.txt')
read.cutmask <- function(filename) {
read.pwm <- function(lines, startMarker, mask = 10) {
skipCount = which(lines == startMarker) + 1
read.table(filename, skip=skipCount, nrows=mask, sep=' ',
colClasses = c("character", "numeric", "numeric", "numeric", "numeric", "numeric"))
}
lines = readLines(filename)
pwm.simple = read.pwm(lines, "simple pwm:")
pwm.em = read.pwm(lines, "EM pwm:")
read.ic <- function(lines, startMarker) {
skipCount = which(lines == startMarker)[2]
read.table(filename, skip=skipCount, nrows=mask, sep=' ')
}
ic.mask = read.ic(lines, "IC fwd_mask merged_mask")
list(simple = pwm.simple, em = pwm.em, ic = ic.mask)
}
plot.pwm <- function(pwm) { require(seqLogo) seqLogo(makePWM(t(pwm[,2:5]))) }
pwms = read.cutmask("UW_MCF7_both_10.5.5.verbose.txt")
plot.pwm(pwms$em)
em.table = pwms$ic
ic = em.table[,1]
mask.ic = ic[seq(1,10,2)] + ic[seq(2,10,2)]
pdf("DNase-IC-kmer_EM.pdf", width=4, height=4)
dotplot(mask.ic ~ c('NCN','NXCXN','NXXCXXN','NXXXCXXXN','NXXXXCXXXXN'),
pch = 19,
cex =1,
col = 'black',
xlab = 'Masked Positions', scales=list(x=list(rot=30)),
ylab = 'Information Content of N positions in mask')
dev.off()
pdf("DNase-IC-kmer_EM_cumsum.pdf", width=4, height=4)
dotplot(cumsum(mask.ic) ~ c('NCN','NNCNN','NNNCNNN','NNNNCNNNN','NNNNNCNNNNN'),
pch = 19,
cex =1,
col = 'black',
xlab = 'Masked Positions', scales=list(x=list(rot=30)),
ylab = 'cumulative IC of N positions in mask')
dev.off()
em.cutmasks = as.character(em.table[,3])[seq(2,10,2)]
seqOutBias.args = "--read-size=36 ~/DNase_ENCODE/hg38.fa ~/DNase_ENCODE/UW_MCF7_both.bam" seqOutBias.cmd = "seqOutBias"
em.scores.dnase.test = mclapply(em.cutmasks, function(cutmask) {
bw.paths = run.cutmask(cutmask, seqOutBias.args, sqcmd=seqOutBias.cmd,
prefix="run_", cleanup = FALSE)
bw.plus = load.bigWig(bw.paths[1])
bw.minus = load.bigWig(bw.paths[2])
eval.cutmask(sites, bw.plus, bw.minus)
}, mc.cores = 4)
em.scores.dnase.10mer = em.scores.dnase
save(em.scores.dnase.10mer, file = 'em.scores.dnase.10mer.Rdata') load("em.scores.dnase.10mer.Rdata")
system('seqOutBias ~/DNase_ENCODE/hg38.fa ~/DNase_ENCODE/UW_MCF7_both.bam --no-scale --read-size=36 --bw=runhc_XXXXXCXXXXX.bw')
tmp2 = eval.cutmask(sites, load.bigWig('runhc_XXXXXCXXXXX.bw'), load.bigWig('runhc_XXXXXCXXXXX.bw'))
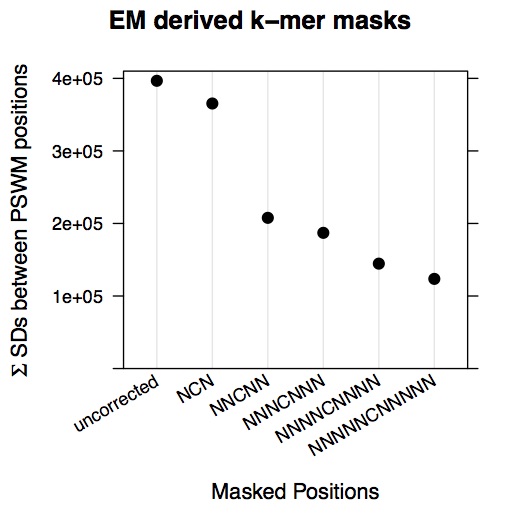
pdf("DNase-kmer_optimization.pdf", width=4, height=4)
dotplot(c(as.numeric(tmp2), as.numeric(em.scores.dnase)) ~ c(' uncorrected',' NCN','NNCNN','NNNCNNN','NNNNCNNNN','NNNNNCNNNNN'),
pch = 19,
cex =1,
col = 'black',
main = "EM derived k-mer masks",
ylim = c(0, 410000),
xlab = 'Masked Positions',
scales=list(x=list(rot=30)),
ylab = expression(paste(Sigma, ' SDs between PSWM positions')))
dev.off()